Welcome to the Hilltop
Since 1889, Saint Anselm College has provided a transformative education shaped by Catholic and Benedictine values and a liberal arts foundation. Here, you are part of a welcoming community where you will discover your passions, experience cherished traditions, and unlock your full potential.
Top100.00100
national liberal arts college by Forbes
99.0099%
of identified graduates of the class of 2023 are either employed, pursuing further education, serving in the military, or volunteering
#24.0024
most engaged in community service by Princeton Review

Celebrating 50 Years of Women’s Education
This year marks 50 years of women’s education and achievements at Saint Anselm College. To commemorate this extraordinary milestone, the college is celebrating with events and programs centered around the women of the past and present who have made Saint Anselm College what it is today.
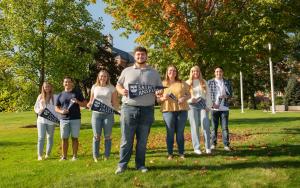
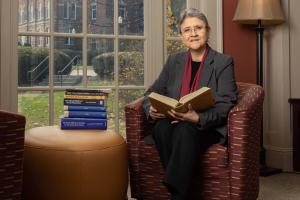
Meet Our Anselmians

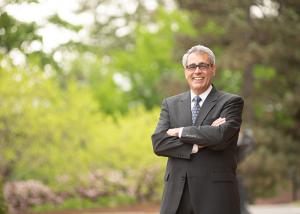
"I believe with all my heart that today’s world needs Saint Anselm College, a place that is infused with the Catholic and Benedictine values of community, hospitality and love, where the humanities, arts and sciences and professional programs like nursing, criminal justice and business build on our liberal arts core rather than compete with it. We need a place where you don’t have to choose between career outcomes and life outcomes. That place is Saint Anselm."
In the classroom and in the community, an Anselmian education will challenge you to find your best self.
Anselmian News
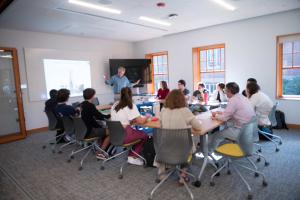
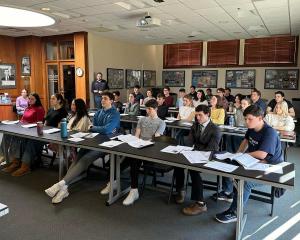
Interdisciplinary Special Topics Course is “Unlike Any Other”
Last fall, a new special topics course blended history and literature in a…
Anselmians Make Record Gifts to Support Saint Anselm College Now and Always
During the 10th annual Days of Giving campaign, the college a record $1.43…
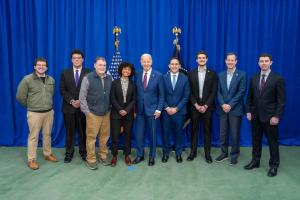
Saint Anselm students play role in President Biden’s NH visit
Students reflect on the important role they played in President Biden’s…
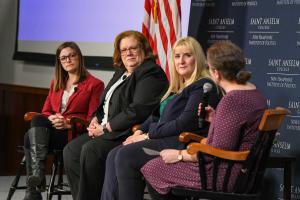
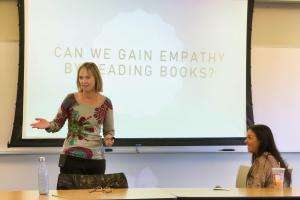
Women and Politics: NHIOP Celebrates 50 Years of Women’s Co-Education
Three notable women in the political field discussed the role of women in…

Chapel Arts Center Hosts a Retrospective on long-time Photography Professor
“The Intimacy of Seeing: Elsa Voelcker – A Retrospective,” the current…

Meelia Center's 32nd Annual Valentine's Dance Spreads Love and Inclusion in the Community
The Meelia Center for Community Engagement spread love in the community as…
NHIOP Welcomes 2024 Cohort of Kevin B. Harrington Student Ambassadors
The New Hampshire Institute of Politics welcomes 29 new Student Ambassadors…
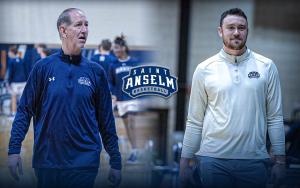
Saint Anselm Men’s Basketball Coach Keith Dickson Announces Retirement; Chris Santo ‘15 Named New Head Coach
After 38 years and 719 victories across 37 seasons, Saint Anselm College…

Write-In | April 16 | 7-10 p.m.
Get your writing done in the company of others!
The Academic…
FEATURED FACULTY MEMBER
Theology Professor Ahida Pilarski, Ph.D. was featured in the most recent issue of Portraits Magazine's Focus on Faculty.
"The first program in women’s studies in the United States was approved at San Diego State University in 1970. Saint Anselm College also is celebrating the 50th anniversary of women at the college this year. It is nice to know that our college joined this major change of increasing the access of women to education."
Anselmian Events

Professor Joshua Tepley and the students in PH 220 Women in Philosophy will host a panel discussion of alumnae Philosophy majors to discuss the role and contribution of women in Philosophy. Learn how these women used their Philosophy major as a catalyst to personal growth and professional success.

The event will consist of a panel discussion and student networking opportunities.
Event details for 50 Years of Saint Anselm Women in Leadership

HOPE is a faith-based group that meets once a week. All people are welcome, regardless of where you are on your faith journey. While we will be reading from the Christian Bible and discussing Jesus and the Christian faith, please note that anybody of any faith is welcome to come, hear others, and share their heart.
Contact us for more info: Campusministry@anselm.edu

Topics that will be discussed include Diagnostic Criteria, Research and Advanced Science, Barriers to Care and Provider Burnout, and Telemonitoring and the New Supports.
To be or not to be: Is that really the question?
Prof. Kevin Staley, Philosophy Department

Concert featuring students in MU180A Chamber Music Ensemble.