Welcome to the Hilltop
Since 1889, Saint Anselm College has provided a transformative education shaped by Catholic and Benedictine values and a liberal arts foundation. Here, you are part of a welcoming community where you will discover your passions, experience cherished traditions, and unlock your full potential.
Top100.00100
national liberal arts college by Forbes
99.0099%
of identified graduates of the class of 2023 are either employed, pursuing further education, serving in the military, or volunteering
#24.0024
most engaged in community service by Princeton Review

Celebrating 50 Years of Women’s Education
This year marks 50 years of women’s education and achievements at Saint Anselm College. To commemorate this extraordinary milestone, the college is celebrating with events and programs centered around the women of the past and present who have made Saint Anselm College what it is today.
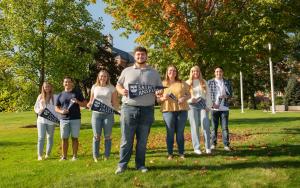
Meet Our Anselmians


"I believe with all my heart that today’s world needs Saint Anselm College, a place that is infused with the Catholic and Benedictine values of community, hospitality and love, where the humanities, arts and sciences and professional programs like nursing, criminal justice and business build on our liberal arts core rather than compete with it. We need a place where you don’t have to choose between career outcomes and life outcomes. That place is Saint Anselm."
In the classroom and in the community, an Anselmian education will challenge you to find your best self.
Anselmian News
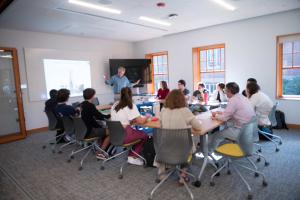
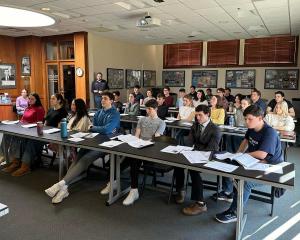
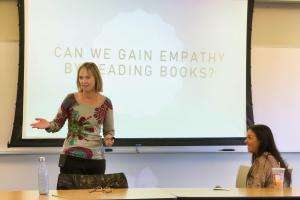
Interdisciplinary Special Topics Course is “Unlike Any Other”
Last fall, a new special topics course blended history and literature in a…
Anselmians Make Record Gifts to Support Saint Anselm College Now and Always
During the 10th annual Days of Giving campaign, the college a record $1.43…
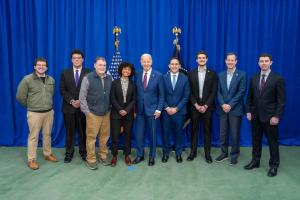
Saint Anselm students play role in President Biden’s NH visit
Students reflect on the important role they played in President Biden’s…

Chapel Arts Center Hosts a Retrospective on long-time Photography Professor
“The Intimacy of Seeing: Elsa Voelcker – A Retrospective,” the current…

Meelia Center's 32nd Annual Valentine's Dance Spreads Love and Inclusion in the Community
The Meelia Center for Community Engagement spread love in the community as…
NHIOP Welcomes 2024 Cohort of Kevin B. Harrington Student Ambassadors
The New Hampshire Institute of Politics welcomes 29 new Student Ambassadors…
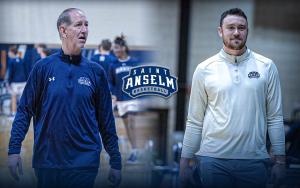
Saint Anselm Men’s Basketball Coach Keith Dickson Announces Retirement; Chris Santo ‘15 Named New Head Coach
After 38 years and 719 victories across 37 seasons, Saint Anselm College…

Write-In | April 16 | 7-10 p.m.
Get your writing done in the company of others!
The Academic…
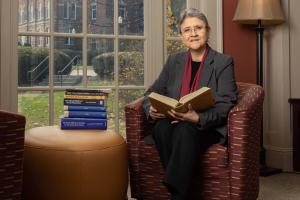
FEATURED FACULTY MEMBER
Theology Professor Ahida Pilarski, Ph.D. was featured in the most recent issue of Portraits Magazine's Focus on Faculty.
"The first program in women’s studies in the United States was approved at San Diego State University in 1970. Saint Anselm College also is celebrating the 50th anniversary of women at the college this year. It is nice to know that our college joined this major change of increasing the access of women to education."
Anselmian Events

Join housing experts from The Pew Charitable Trusts to discuss their latest research on policy changes that are improving housing supply and affordability.
The discussion will examine how policymakers across the country are effectively addressing housing shortages, soaring costs, and limited access to financing. In particular, the event will cover multiple topics at the heart of current housing policy debates, including rents and effects on housing costs, public opinion, homelessness, parking, accessory dwelling units and manufactured housing.
Event details for How are policymakers improving access to lower-cost homes?
What makes a college Catholic?
Dr. Duane Bruce

Join Saint Anselm College alumni, parents, and friends for a family-friendly and accessible Day of Service cleaning up the parish and school at St. Raphael. Volunteer duties will include yard work and other outdoor tasks.
The Laisser Faire Fashion Show encompasses the talent and endless creative genius of students here in the Men of Color Club. The completely student-run project in collaboration with various campus-wide organizations, and neighboring institutions such as SNHU and Umass Lowell. The Laisser Faire experience includes 52 models from various backgrounds and 13 clothing brands from all parts of the United States. The Laisser Faire experience will set the standard of what a club can do.
Location: Sullivan Arena

Celebrate your final days with a high end meal, chocolate fondue station and a full bar. Join your class on the dance floor with our DJ. Dress to impress!
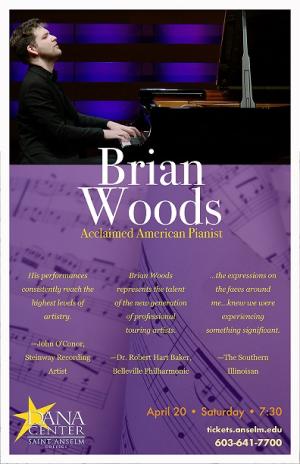
Celebrated for his stunning musicianship and dazzling stage presence, American pianist Brian Woods has emerged as an exciting performer of international acclaim. His 2023-2024 Season includes concert tours across the United States, including performances for the L'ermitage Foundation (Los Angeles, CA), the Dana Center for the Performing Arts at Saint Anselm College (Manchester, NH), Connect2Culture (Joplin, MO), the Glema Mahr Center for the Arts (Madisonville, KY), the Keokuk Concert Association (Keokuk, IA), the Steinway Society of Western Pennsylvania (Pittsburgh, PA), and more. Woods is also honored to serve as Music Director for Classical Programming at the World Chess Hall of Fame, one of the premier venues for chamber music in Missouri.
A native of St. Louis, Woods has enjoyed success in numerous distinguished competitions, including the Verona International Piano Competition, The American Prize, the Beverly Hills National Auditions, and the Artist Presentation Society Auditions. Following his debut concerto performance at age eighteen, he maintains an extensive concerto repertoire, from Liszt and Tchaikovsky's First Concerti to Beethoven's Fifth, Brahms' Second, and Rachmaninoff's Third. Woods has recently performed with such ensembles as the Gateway Festival Orchestra, the Quincy Symphony Orchestra, the Belleville Philharmonic, the Manassas Symphony Orchestra, the Southeast Missouri Symphony, the University City Symphony Orchestra, and the Southern Illinois Symphony.
Past seasons have included solo recitals in Toronto, Washington D.C., Nashville, St. Louis, San Diego, Kansas City, Chicago, and Dublin, Ireland. Hailed as “representing the next generation of professional touring artists” (Robert Hart Baker), Woods’ performances continue to receive high acclaim, with audiences and critics alike praising his playing as “astonishing” (KDHX St. Louis), “inspiring” (Encinitas, CA), and “taking the audience on a journey” (Watertown, NY). Woods has collaborated with tenor Vinson Cole and cellist Julian Schwarz, among many other partners in the United States and Canada. His artistic partnership with Canadian violinist Daniel Dastoor as the Dastoor-Woods Duo has led to notable performances for Music Toronto and the Banff Centre for Arts and Creativity.
Past mentors include Craig Nies, Robert Weirich, Stanislav Ioudenitch, and Donna Vince. Woods holds degrees from Vanderbilt University, University of Missouri - Kansas City, Shenandoah University, and the Royal Conservatory's Glenn Gould School, where he completed the Artist Diploma Program on full scholarship with famed Irish pianist and Beethoven interpreter John O'Conor. Visit brianwoodspianist.com to learn more or follow Brian on Instagram, Facebook, and YouTube @brianwoodspianist.
ALL SALES ARE FINAL
NO REFUNDS OR EXCHANGES